A refund claim lives or dies on its evidence. You can be certain bots drained your budget, but certainty isn't proof, and a platform review team only acts on what you can show. So the real question isn't "was my traffic invalid?" It's "can I document it well enough for someone else to see what I see?" In 2025, fraud0's Unmasking the Shadows report found 21.3% of onsite traffic was invalid (search-engine crawlers excluded) across 1.2 billion sessions. That's a lot of activity to document. Specifically, this guide shows you which signals count as evidence. It also covers how to capture them and, importantly, what makes a case credible to a reviewer.
Key Takeaways
Credible refund evidence rests on signals you can show, not suspicions you hold: behavioral anomalies, IP and device patterns, conversion fraud, and timestamps that point to non-human activity.
The strongest behavioral evidence is the gap from your own baseline, not a fixed number. fraud0's aggregate finding (invalid users averaged 1.2 page views and far shorter sessions than real visitors) shows how wide that gap runs.
Onsite, first-party detection captures evidence platform dashboards can't, because it watches what visitors actually do after the click, not just the click.
Strong documentation improves your odds. It never guarantees them. Outcomes depend on detected invalid activity and the platform's review, and money usually returns as account credit, not cash.

Most marketers approach a refund claim backwards. They start with the conclusion ("this traffic was fake") and hope the platform agrees. A reviewer, however, works the other way. They start with your evidence and decide what it proves. This post, therefore, is about closing that gap, building documentation a stranger can read and reach the same conclusion you did. We won't cover the full claim process here. For that, see the ad-spend refund guide. Instead, this is the deep dive on the evidence itself.
What counts as invalid activity refund evidence?
Refund evidence is any documented, verifiable signal that traffic charged to your account behaved like a bot, not a buyer. It is the bridge between what you suspect and what a reviewer can confirm. In 2025, fraud0's Unmasking the Shadows report found 9.75% of conversions were invalid (7.82% confirmed bot plus 1.92% suspected) across 1.2 billion sessions. Evidence is how you turn that invisible share into something a reviewer can examine and verify.
A few terms anchor everything below. Invalid traffic (IVT) is any ad interaction that does not come from a genuine, interested human, whether from bots, click farms, or accidental and fraudulent clicks. Ad fraud is the deliberate subset of that activity, engineered to drain budgets or fake results for profit. Conversion fraud is invalid activity that reaches your most expensive metric, generating fake leads, sign-ups, or sales that pollute the data you optimize against. Each of these, once documented, becomes a distinct kind of refund evidence.
The strongest evidence shares one trait: it's specific and reproducible. For example, "my traffic felt fake" proves nothing. "These 4,200 sessions came from a single hosting-provider IP range, each lasted under five seconds, and none scrolled past the fold," in contrast, is something a reviewer can check. Specificity, in other words, is what separates a hunch from a case.
In 2025, fraud0's Unmasking the Shadows report analyzed 1.2 billion onsite sessions and 10.78 billion ad impressions and found 21.3% of onsite traffic invalid (search-engine crawlers excluded) and 9.75% of conversions invalid. Refund evidence converts that hidden invalid activity into documented, verifiable signals, behavioral anomalies, IP and device patterns, and conversion records, that a platform review team can examine.
There are four families of evidence worth knowing. Behavioral anomalies show how traffic acted. IP and device patterns, similarly, show where it came from. Conversion fraud shows fake results polluting your data. Timestamps, in addition, show suspicious timing. The best claims combine several, because one weak signal is a coincidence and four overlapping ones, notably, form a pattern. Let's take each in turn.
How do behavioral anomalies prove traffic was invalid?
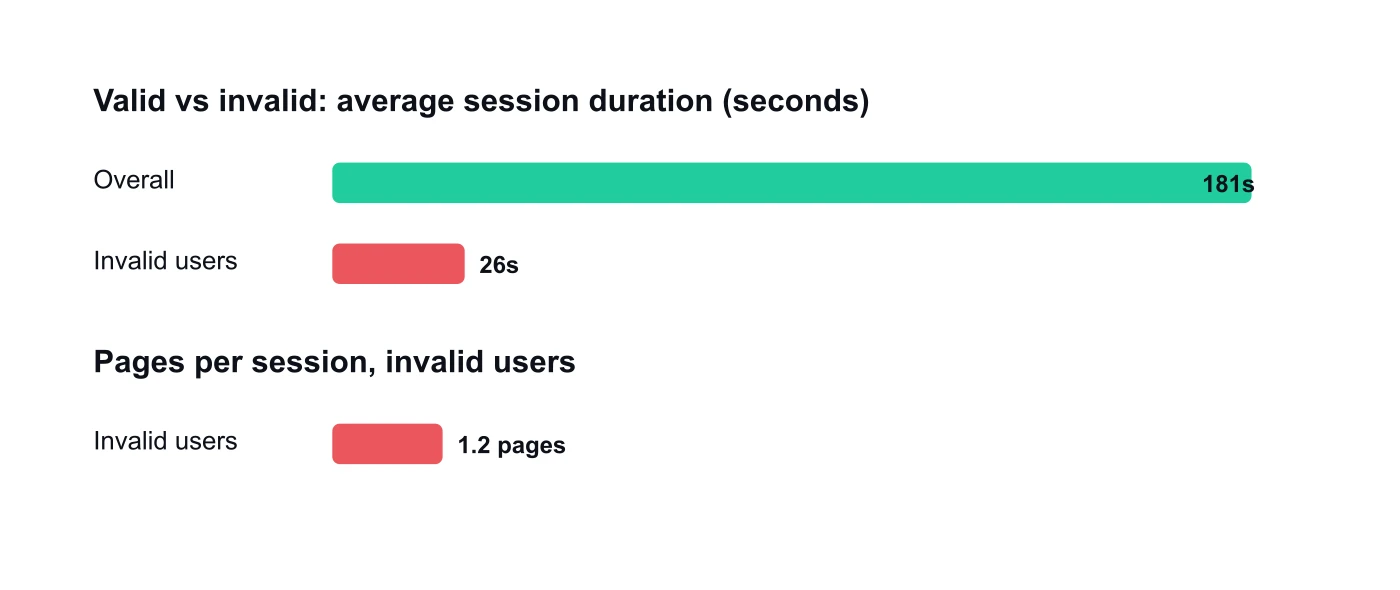
Behavioral anomalies are the clearest evidence because real humans and bots behave differently, and the gap is measurable. In 2025, fraud0's Unmasking the Shadows report found invalid users averaged just 1.2 page views per session and a fraction of the engagement time of real visitors (charted below). The point isn't a single magic number. It's that invalid activity collapses far below your own normal, and when it does, the behavior itself becomes the document.
Consider what a real visitor does. They land, read, scroll, maybe click a second page, hesitate, then convert or leave. A bot built to drain ad budget, however, skips all of it. For instance, it lands and bounces, or it fires a conversion instantly with no browsing in between. You can capture that contrast in plain numbers: time on page, scroll depth, pages per session, mouse movement, and interaction events.
Source: fraud0, Unmasking the Shadows 2025 (1.2 billion onsite sessions; search-engine crawlers excluded).
In 2025, fraud0's Unmasking the Shadows report measured a wide behavioral gap between invalid and real users across 1.2 billion onsite sessions: invalid users averaged 1.2 page views and far shorter sessions (26 seconds against 181 overall). Read as a category, shallow engagement measured against your own baseline is among the most legible forms of refund evidence because it's quantified and reproducible.
In our work analyzing onsite sessions, the most convincing behavioral evidence isn't a single weird visit. It's a cluster of near-identical ones: hundreds of sessions with the same impossible signature, such as a 100% bounce rate from a paid source that should be your most engaged traffic. One outlier is noise. A repeating pattern, by contrast, is a fingerprint.
Which behavioral signals are worth capturing?
Capture the metrics that diverge most from your human baseline. For example, these signals tell the story most clearly:
Session duration against your own normal average, where invalid visits collapse far below your human baseline. For context, fraud0's aggregate finding put invalid users at roughly 26 seconds against 181 overall, but the signal that matters is the gap from your baseline, not a fixed threshold.
Scroll depth, since many bots never move past the fold.
Pages per session, where invalid users averaged just 1.2.
Engagement events like clicks, form focus, and video plays.
Mouse movement and timing, which genuine humans produce and scripted bots rarely fake well.
Here's the part most refund advice misses: your evidence is only as strong as your baseline. In other words, you can't show traffic was abnormal without first documenting what normal looks like for your own site. Therefore, pull a clean reference period, then let the anomalies stand out against it.
What IP and device evidence supports a refund claim?
IP and device patterns are powerful evidence because invalid traffic often clusters around shared infrastructure. In 2024, Imperva's Bad Bot Report concluded that bots made up 51% of all web traffic, the first year automated activity overtook humans. Much of that automation runs from data centers and hosting providers, not home connections, and, as a result, that origin leaves a documentable trail.
Real customers browse from residential and mobile networks, scattered across regions that match your targeting. Bot traffic, however, frequently doesn't. Instead, it concentrates in hosting-provider IP ranges, recycles a narrow set of addresses, or shows device and browser signatures that don't add up, such as an outdated headless browser or a screen resolution no real phone uses. Each of these, notably, is a data point you can log.
In 2024, Imperva's Bad Bot Report found bots comprised 51% of all web traffic, with much automated activity originating from data-center and hosting infrastructure rather than residential connections. IP-origin clustering, repeated addresses, hosting-provider ranges, and mismatched device signatures, is documentable evidence that traffic charged to a campaign was likely non-human.
A word of care here. A single IP appearing twice isn't fraud, and you should never present it that way. The evidence is the pattern: a concentration of clicks from a narrow range, an impossible volume from one address, or a device profile that repeats across hundreds of "different" users. Document the cluster, not the coincidence.
How do you capture IP and device data responsibly?
Log origin data at the session level and aggregate it, IP range, autonomous system or hosting provider, device type, browser, and user agent. Then look for concentration. Keep one thing in mind, however: in the EU, IP addresses can be personal data under the GDPR, so handle them lawfully and avoid building dossiers on individuals. The goal, specifically, is to show a pattern of invalid activity, not to track people. As a result, a detection platform that's built EU-resident handles this framing for you.
How does conversion fraud become refund evidence?
Conversion fraud is some of the most valuable evidence because it hits the metric you actually pay for. In 2025, fraud0's Unmasking the Shadows report found 9.75% of conversions were invalid (7.82% confirmed bot plus 1.92% suspected). When fake conversions inflate your results, they don't just waste budget. Moreover, they corrupt the data you use to optimize, so the damage compounds.
What does conversion fraud look like in your records? Form fills with gibberish or templated entries, for example. Leads with disposable email domains and phone numbers that never answer. Sign-ups that convert in under a second, with no browsing before the action. Bursts of identical conversions clustered in time, similarly, stand out. Each fake lead you can isolate and annotate, therefore, is a concrete exhibit, not an abstract claim.
In 2025, fraud0's Unmasking the Shadows report found 9.75% of conversions invalid (7.82% confirmed bot and 1.92% suspected) across 1.2 billion sessions. Documented conversion fraud, fake form fills, disposable contact details, and instant zero-engagement conversions, is high-value refund evidence because it ties invalid activity directly to the outcomes an advertiser is billed against.
Conversion-level evidence often persuades where click-level evidence stalls. A reviewer can argue a cheap click was a curious human. It's far harder, in contrast, to explain away a "lead" with a fake name, a throwaway inbox, and a sub-second conversion that never loaded a second page. In short, the closer your evidence sits to the money, the harder it is to dismiss.
Why does first-party data beat platform-reported metrics?
First-party, onsite detection produces stronger evidence because it watches what platform dashboards structurally can't see. Your ad platform measures the click. It can't measure the near-empty session, the gibberish form fill, or the scroll that never happened, because all of that occurs on your site, after the click. In 2025, fraud0's Unmasking the Shadows report measured 21.3% of onsite traffic invalid (search-engine crawlers excluded) precisely by observing that onsite behavior.
This isn't a knock on any platform. It's a vantage-point limit. A platform sees its own surface: impressions, clicks, and the signals it can detect at its edge. It doesn't, however, sit on your site recording how each visitor behaves afterward. Onsite detection does, and that downstream behavior is exactly where the most legible evidence lives. The two views, therefore, are complementary, but only one of them captures the post-click story.
In 2025, fraud0's Unmasking the Shadows report measured 21.3% of onsite traffic as invalid (search-engine crawlers excluded) by observing post-click, onsite behavior across 1.2 billion sessions. Platform dashboards measure the click; first-party onsite detection measures what the visitor does next, which is where behavioral, conversion, and engagement evidence for a refund claim is generated.
fraud0's own dataset is built this way, on 1.2 billion onsite sessions and 10.78 billion ad impressions, observed where the click lands rather than where it originates. That onsite vantage point is why the report can quantify session duration, page views, and conversion validity at all, signals a click-level view simply doesn't hold.
Here's the honest limit. Onsite detection reduces how much invalid traffic you pay for, but it can't pre-block every bot. A brand-new bot's very first click, for instance, arrives before any system has seen it, so some invalid activity always slips through. That residual, consequently, is exactly why documentation and refunds stay essential, not optional. Detection and recovery, in other words, work together: one shrinks the leak, the other recovers what gets through.
How do you organize evidence so a reviewer takes it seriously?
Organized evidence wins because a reviewer's time is finite and their default is skepticism. Therefore, make the pattern obvious in seconds, not buried in a raw export. The structure matters as much as the data: a tidy summary with supporting detail, for example, beats a 50,000-row spreadsheet with no narrative. Specifically, lead with the finding, then let the evidence back it.
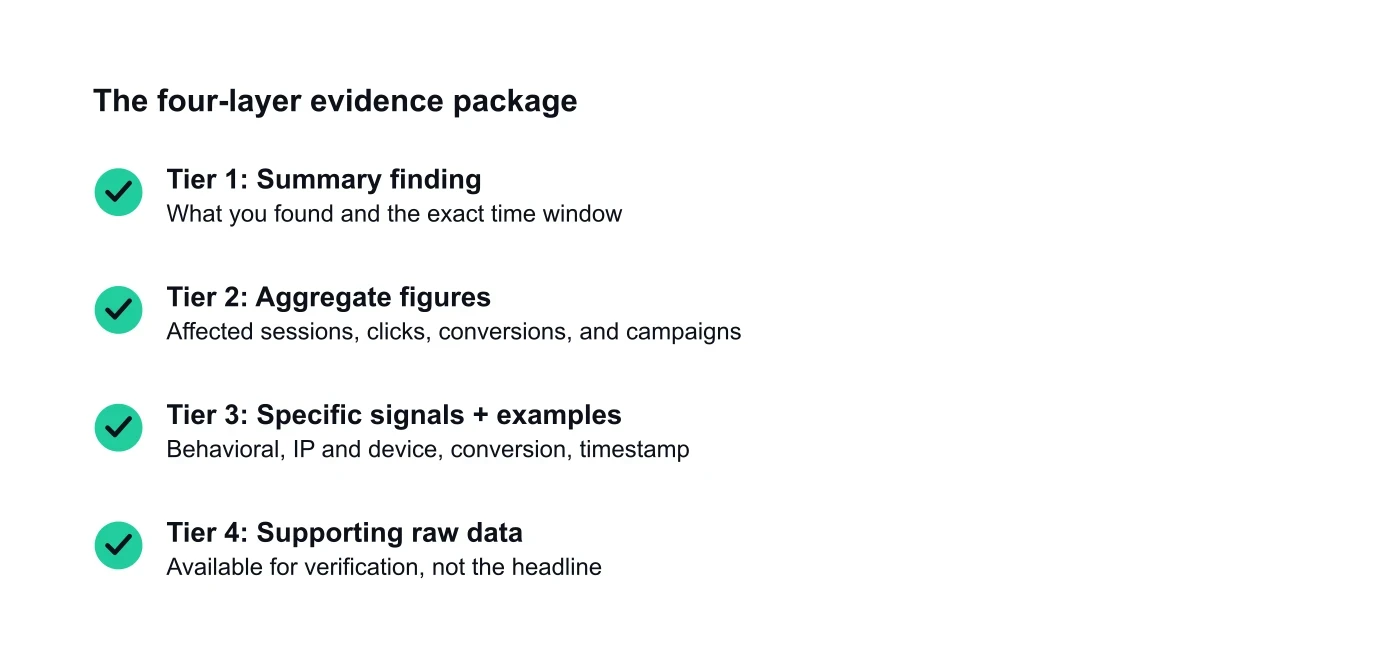
A credible evidence package usually has four layers. First, a short summary stating what you found and the time window. Next, a set of aggregate figures (affected sessions, clicks, or conversions, and the campaigns involved). In addition, the specific signals (behavioral, IP and device, conversion, timestamp) with examples. Finally, the raw data, available but not the headline. Think exhibits in a case file, in other words, not a data dump.
Source: fraud0 evidence-packaging framework, Unmasking the Shadows 2025.
In 2025, fraud0's Unmasking the Shadows report quantified invalid activity, 21.3% of onsite traffic (search-engine crawlers excluded), 9.75% of conversions, and a wide behavioral-engagement gap between invalid and real users. Refund evidence is most credible when organized into layers: a summary finding, aggregate figures, specific named signals with examples, and supporting raw data a reviewer can verify.
We've found the single most common mistake is volume over clarity. Marketers send everything, hoping more data looks more convincing. In fact, it does the opposite. A reviewer who has to find your point usually won't. Therefore, make the pattern legible first, then keep the depth on hand for anyone who wants to check it.
One honest caveat to carry through all of this. Even airtight documentation doesn't guarantee a refund. Outcomes depend on the invalid activity actually detected and on each platform's review process, and platforms like Google typically return money as account credit toward future spend rather than cash. For how that distinction plays out, see invalid-activity credits versus refunds. Strong evidence, that said, improves your odds. It simply doesn't remove the platform's judgment from the loop.
Building the evidence that filtering can't see
The pattern across all four evidence families is consistent. The signals that prove invalid traffic, empty sessions, IP clusters, fake conversions, suspicious timing, all live in how traffic behaves after the click. That's the ground your ad platform's dashboard doesn't stand on. In 2025, fraud0's Unmasking the Shadows report measured 21.3% of onsite traffic as invalid (search-engine crawlers excluded) and 9.75% of conversions invalid precisely by watching that onsite behavior. Documentation, therefore, is how you turn it into a case.
Two honest reminders to close. First, strong evidence improves your odds but never guarantees a refund, and recovered money usually arrives as account credit, not cash. Second, documentation and prevention aren't a choice between two things; instead, they're the same fight from two angles: reduce the waste going forward, recover the residual that gets through.
fraud0's onsite, first-party detection is built to produce exactly this evidence, the post-click behavioral, IP, and conversion signals a click-level view can't capture, with EU-resident data handling. To give you a sense of the scale, our bot detection runs more than 2,000 checks in real time. The more red flags we identify, the more confidently we can determine whether the traffic is generated by a bot. If you want to see what your own traffic is hiding, that's where to start. For the bigger picture, here's how to recover wasted ad budget, and if you're choosing a detection tool, here's a click fraud protection buyer's guide.