Imagine this: You open your analytics dashboard on Monday morning. The charts look clean, the traffic looks stable, and your campaigns appear to be performing. You exhale. Everything seems fine.
But here’s the problem: “clean reports” don’t always mean “clean campaigns.” Sometimes they just mean your analytics never saw the fraud in the first place.
For years, advertisers have been reassured with glossy dashboards and vendor reports telling them fraud is “low” and campaigns are “working.” The truth? Much of that reassurance rests on shaky foundations. Bots have gotten smarter, verification tools are easy to bypass, and platforms often measure themselves.
To understand the blind spots, let’s look at six common lessons marketers discover when they start digging deeper into their analytics data.
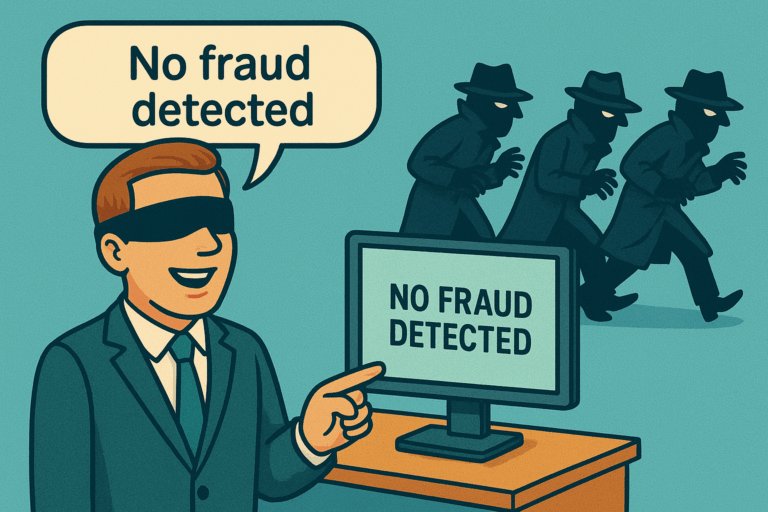
Lesson One: When “No Fraud Detected” Means “No Fraud Measured”
Most marketers assume: if fraud isn’t flagged, it didn’t happen. But that’s not true.
Example: You’re running a large display campaign. Your verification tool reports everything is fine. Behind the scenes, however, fraudsters may have blocked the verification tags before they loaded. The system collected no signals, and the report came back “clean.”
That doesn’t mean no bots were present. It means your system was blind.
Takeaway: A clean report is not proof of campaign health. It may just signal a failure in measurement.
Lesson Two: Reported Traffic ≠ Real Traffic
Analytics platforms only measure part of the picture, especially in regions with strict privacy laws. Under GDPR, users must actively consent to be tracked. Let´s say only 60% of visitors do so, which means you may be missing out on up to 40% of your audience.
The picture varies: some countries and industries achieve higher consent rates, while others remain well below average. On mobile apps, Apple’s App Tracking Transparency (ATT) reinforces this gap, since most iOS users refuse tracking.
Even if your CMP (Consent Management Platform) provides opt-in statistics, your analytics data often depends on rough extrapolations, especially when it comes to conversions or campaign ROI.
What most people don’t realize is that bots also “accept” CMP banners, leading to misleading consent data. So even your 60% dataset is not 100% trustworthy.
Takeaway: Your dashboards are likely built on incomplete traffic. What looks like accuracy is often guesswork.
Lesson Three: Declared Data Isn’t the Whole Story
Log-level data often gets praised as the gold standard because it is granular and timestamped. But it still only reflects what was declared in the bid request, not what actually happened afterward.
A bid might say your ad was destined for a premium news site. In reality, it could appear on a spoofed domain, inside an invisible iframe, or on a junk site flooded with bots.
It’s like booking a luxury hotel online, only to find yourself in a dingy motel with the same name.
Takeaway: Declared data is not the same as delivered data. Unless you measure what really rendered, you’re only seeing what fraudsters want you to see.
Lesson Four: Why Server Logs Alone Miss Fraud
Server-side logs show who bid, what was declared, and when. But they don’t prove:
- that your ad actually rendered in a visible space
- that a real human saw it
- that the environment matched what was declared
Postbid, in-browser detection is critical. It collects signals you can’t fake easily, such as whether the ad was truly in view or whether the interaction came from a human.
If your tracking scripts never run, that silence itself is a warning sign. Server logs would never capture it.
Takeaway: Server logs are helpful, but incomplete. Without postbid measurement, you’re flying blind.
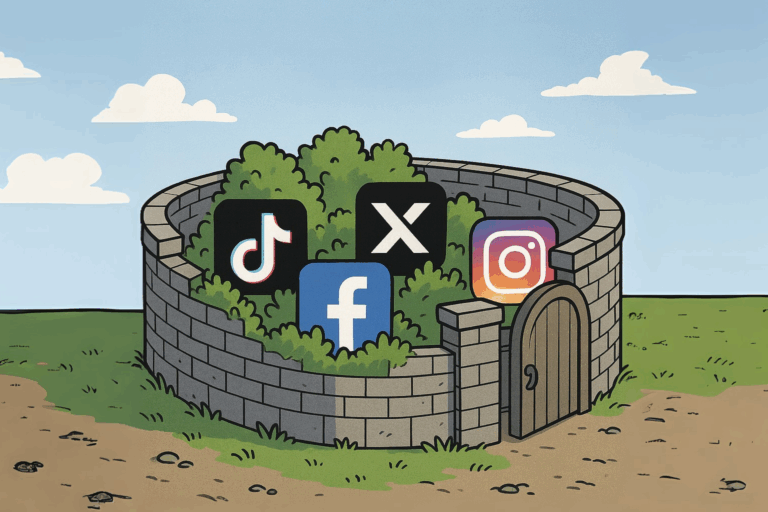
Lesson Five: The Walled Garden Problem
Campaigns on platforms like Facebook, Instagram, or YouTube provide little independent reporting. These “walled gardens” don’t allow third-party tags, so verification vendors often just repackage the platform’s own numbers.
It’s like asking a student to grade their own exam. Unsurprisingly, the results always look good.
Takeaway: In closed environments, you’re not verifying—you’re trusting. And trust is not the same as proof. Which means you need to measure where it all ends up—your website.
Lesson Six: Why Fraud Persists
Ad fraud doesn’t continue because it can’t be stopped, but because too many players in the ecosystem benefit from it. More spend often translates into more revenue, regardless of quality. More clicks and impressions—whether human or not—still look like success in many reports. Filled inventory keeps publishers satisfied, also the shady ones. In the end, the advertiser is the one who consistently loses.
Takeaway: Fraud is not just a technical glitch, it is a business model.
Lesson Seven: Why Analytics Numbers Don’t Match
Have you ever compared reports across different analytics setups and found discrepancies? These mismatches often come from:
- differences in data models
- privacy restrictions and consent rates
- automatic bot filtering you cannot review
Since most analytics providers don’t disclose how filtering works, you end up with two different versions of reality and no way to know which is closer to the truth.
Takeaway: Discrepancies are not bugs, they are symptoms of hidden blind spots.
Conclusion
Analytics reports often look reassuring, but they hide as much as they reveal. Fraud lives in the blind spots: in blocked tags, missing consent data, unverifiable platforms, and convenient discrepancies.
The real shift happens when you stop taking dashboards at face value and start asking harder questions. That curiosity is what turns a passive buyer into an informed marketer.