Understanding invalid traffic (IVT) is essential for optimizing digital marketing efforts. Today, we’re diving into key findings from an in-depth analysis of a customer’s website traffic, examining where IVT originates across various channels, devices, and geographies. By carefully analyzing this data, we’ve identified actionable patterns and optimization opportunities to keep IVT to a minimum and improve overall marketing efficiency.
IVT Breakdown: Identifying the Best and Worst Performers
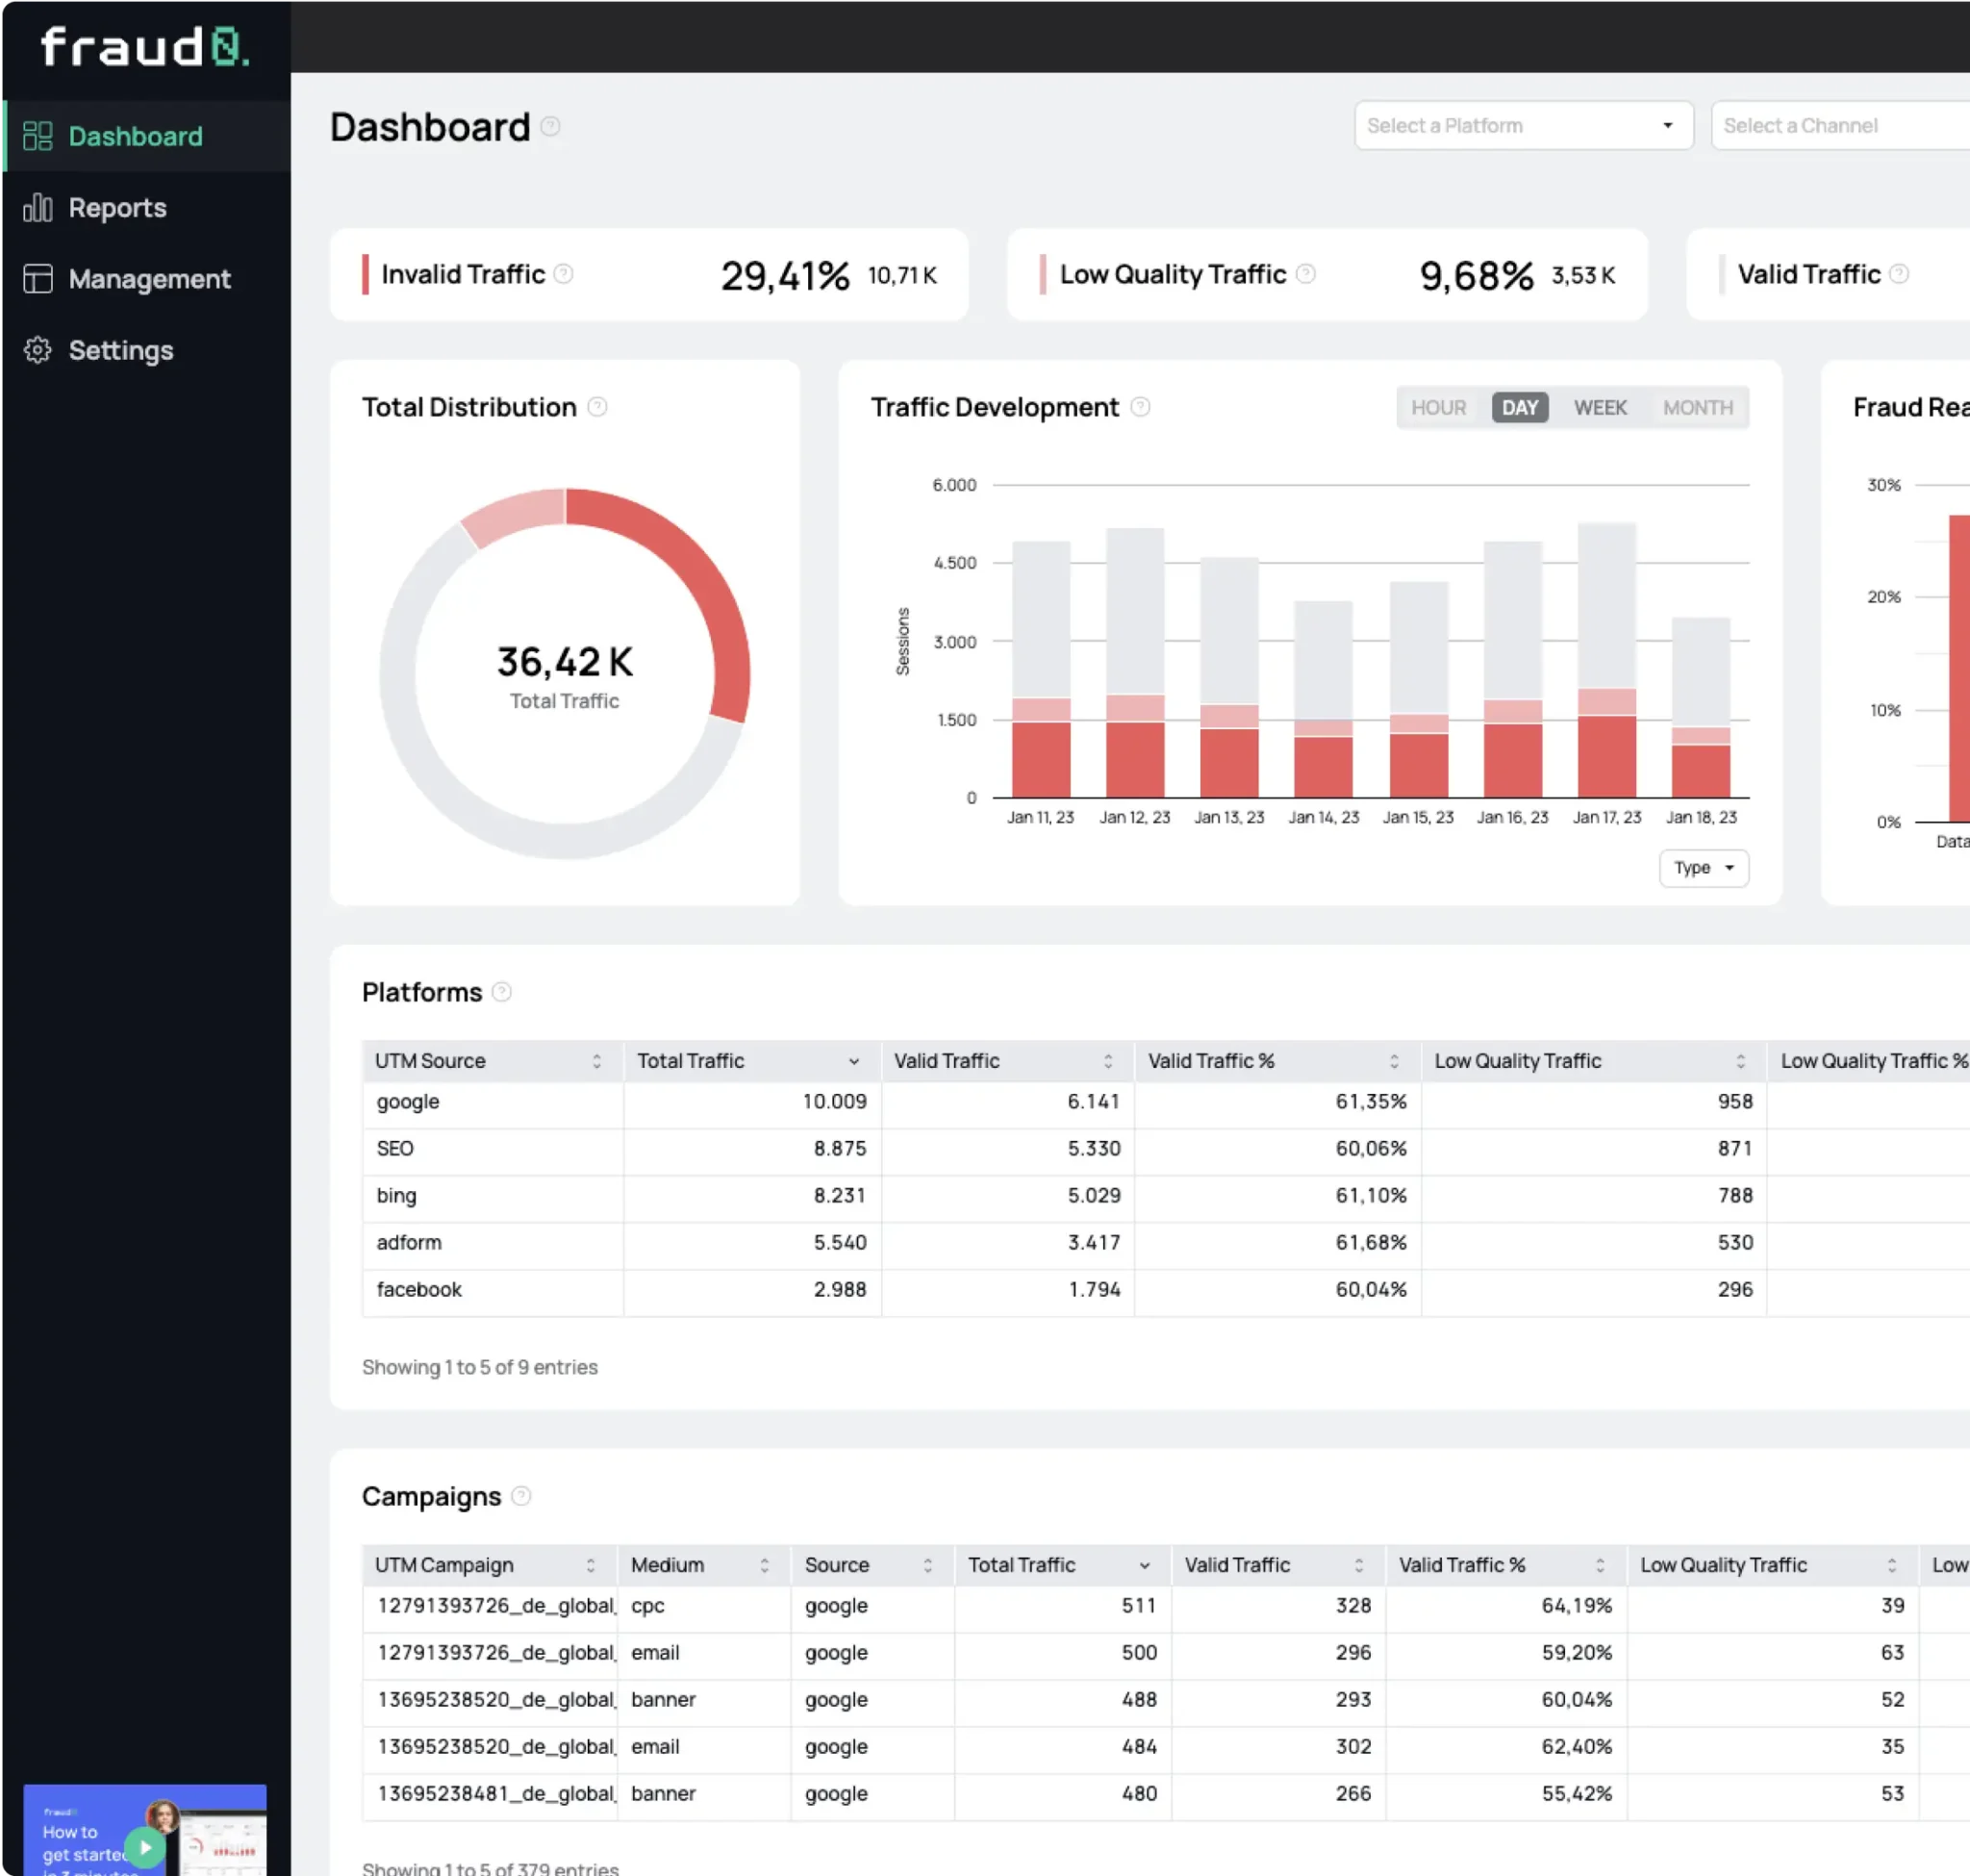
In total, IVT accounted for 11% of traffic, which is solid considering that our benchmark for IVT from our Unmasking the Shadows 2025 report is 21.3%. However, there’s still significant room for improvement. A critical first step in reducing IVT is identifying the channels contributing most to this unwanted traffic and understanding their impact.
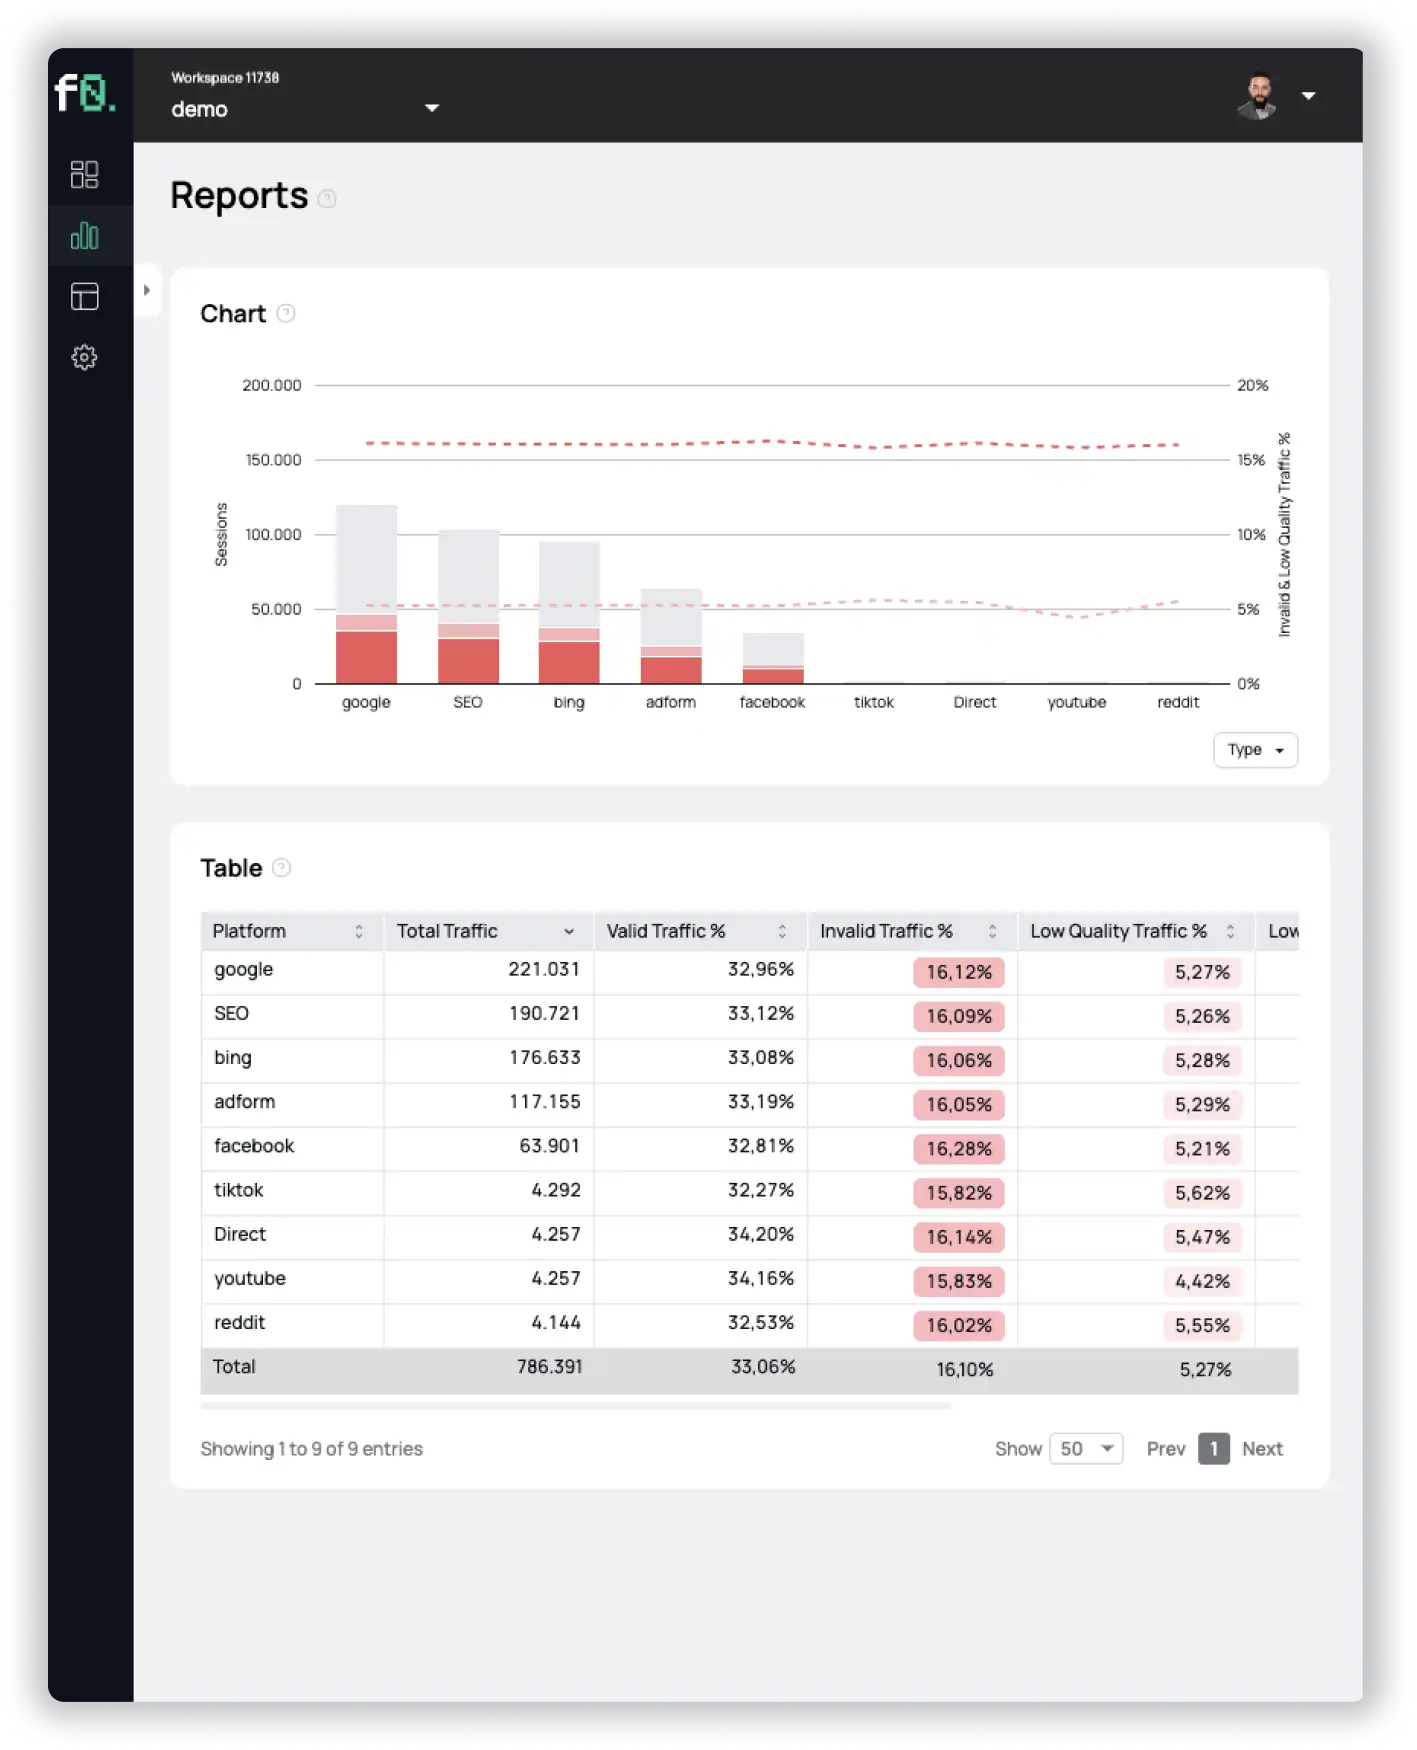
Our analysis revealed substantial variations across different traffic sources. Direct traffic exhibited the highest IVT rate at 42%, followed by Microsoft Ads at 12.5%. Meanwhile, Facebook Ads and SEO performed significantly better, with IVT rates of 7.2% and 4%, respectively. These findings indicate that certain channels require stricter filtering and optimization. To maximize return on ad spend (ROAS) and ensure high-quality engagement, we recommend shifting more budget toward channels that demonstrate stronger performance with valid traffic.
The Challenge of Returning Bot Traffic
Beyond understanding which channels contribute to IVT, identifying recurring bot activity is crucial. Over a 19-day period, Google-Paid traffic recorded 5.3K bot discrepancies and 35 visits from automation tools. Notably, 662 returning bot IPs generated 5,041 bot sessions. What’s more concerning is that 35% of these bot IPs also interacted with other paid advertising channels, such as RTB House, Criteo, Microsoft Ads, and Facebook Ads.
This pattern underscores the need for continuous monitoring and filtering. When bots repeatedly access a site from multiple paid sources, they not only skew performance metrics but also waste advertising budgets. Implementing advanced bot detection measures and blocking IP addresses can help mitigate these risks.
IVT in PMax: A Platform Prone to Invalid Traffic
Among paid advertising platforms, Google PMax campaigns showed notably higher IVT rates compared to Google Search. This is primarily due to the broad reach of PMax, which spans multiple Google ecosystems, including the Google Display Network (GDN), YouTube, Gmail, and partner sites. While this wide exposure can increase visibility, it also elevates the risk of attracting invalid traffic.
Our analysis found that 7% of PMax traffic was classified as invalid. To counter this, implementing strong exclusions within PMax campaigns is critical. By actively filtering low-quality traffic and optimizing targeting parameters, advertisers can minimize IVT and improve overall ad performance. Additionally, ongoing monitoring and strategic adjustments are necessary to keep IVT as low as possible and ensure ad budgets are used effectively.
If you want to know more about PMax, we recommend our article PMax Decoded: Waste of Money or Effective Channel?.
Data Centers: A Major IVT Source
Another key insight from our analysis was the significant role of data centers in generating IVT. In fact, 52% of all IVT originated from just two data centers. This highlights the importance of proactively blocking IP addresses associated with these sources in paid advertising platforms. Implementing exclusion lists can help prevent further bot-driven traffic, ensuring that marketing spend is directed toward genuine user interactions.
Geographic IVT Distribution: Identifying High-Risk Regions
IVT is not just platform-dependent, it also varies significantly by geography. After filtering out self-declared crawlers, we found that certain countries contributed disproportionately to overall IVT. Germany alone accounted for 70% of total IVT, while Finland, the U.S., and Ireland collectively made up another 25%.
To combat this, advertisers should implement real-time country exclusions based on ongoing data analysis. Excluding high-risk regions from paid campaigns can help prevent wasted ad spend and improve overall traffic quality.
Conclusion: A Data-Driven Approach to Long-Term Optimization
This analysis reinforces the importance of continuous monitoring and refinement in digital marketing. Reducing IVT is not a one-time fix but an ongoing process requiring agility and data-driven decision-making. By identifying high-risk channels, tracking returning bot traffic, optimizing PMax campaigns, blocking data center traffic, and refining geographic targeting, advertisers can create a more efficient and high-quality traffic funnel.
Ultimately, the goal is not to eliminate IVT entirely, some level of IVT will always exist, but to minimize its impact while enhancing user engagement and maximizing ROAS. A proactive, well-structured approach to IVT management will lead to stronger campaign performance and more meaningful customer interactions over time.